

WORLDWIDE FREIGHT SERVICES
Email: jack@transworldcn.com

TL;DR – Key Takeaways for Supply Chain Managers
FCL vs LCL breakeven: FCL becomes more cost-effective than LCL once cargo exceeds 12–15 cubic meters (approximately 15 CBM is the industry threshold). Below this volume, LCL offers lower upfront costs.
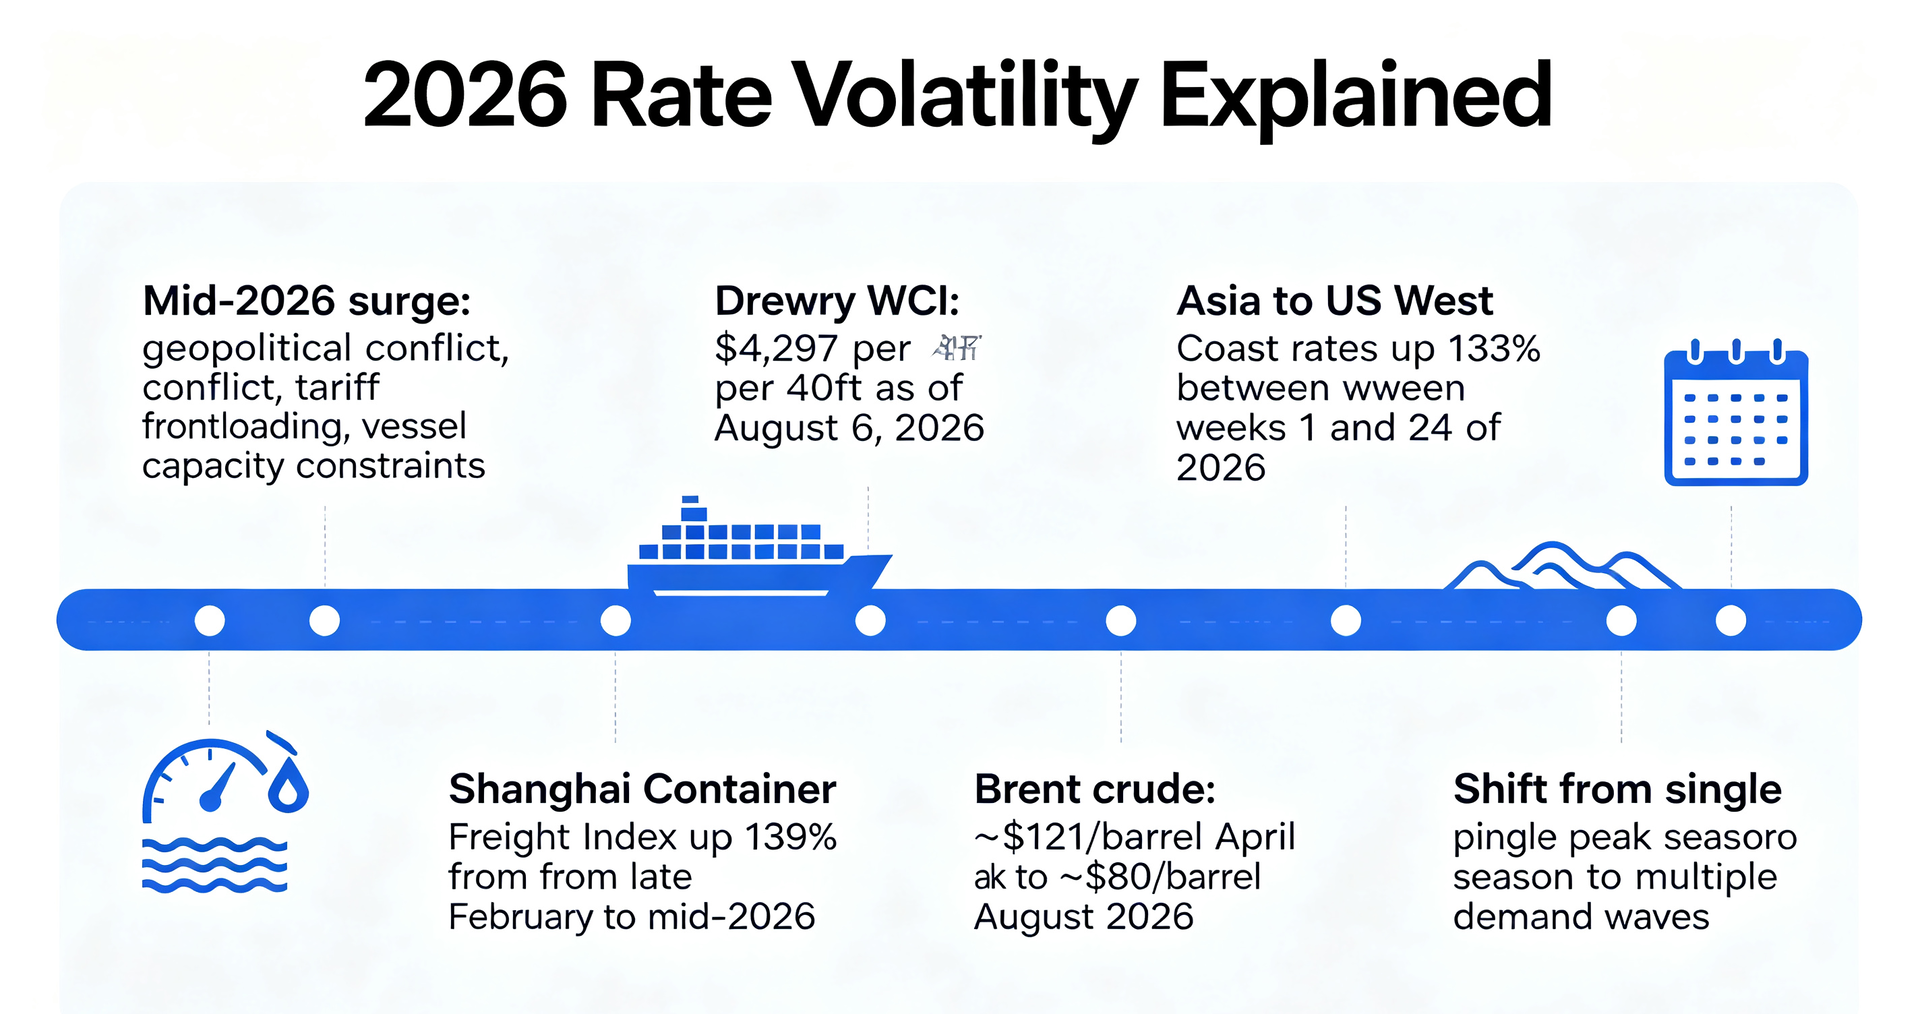
2026 rate environment: After a mid-year surge driven by geopolitical conflicts and tariff frontloading, spot rates are easing. The Drewry WCI stood at $4,297 per 40ft as of August 6, 2026, down from peak levels.
Total cost matters more than base rate: Destination charges (CFS fees, terminal handling, customs clearance), transit time differences, and cargo damage risk often outweigh the base freight rate in total landed cost calculations.
Active cost management is essential: Long-term contracts, early capacity locking, and—for qualified shippers—freight derivatives can help manage rate exposure.
Peak season patterns have shifted: The traditional July-October peak is giving way to multiple "demand waves" driven by tariffs, geopolitical events, and promotional calendars.
For supply chain managers sourcing from China to North America, ocean freight costs have become one of the largest—and least predictable—variables in the landed cost equation. The days of stable, predictable shipping rates are over. In their place is a market shaped by geopolitical shocks, regulatory shifts, and structural changes to global trade routes.
This guide provides a data-driven decision framework for two critical questions facing importers:
How do I choose between FCL and LCL for my shipment? — A total-cost comparison that goes beyond simple per-unit pricing.
How do I manage freight rate volatility and lock in competitive rates? — Practical strategies based on 2026 market dynamics.
The first half of 2026 saw dramatic freight rate increases driven by multiple converging factors:
Geopolitical conflict: The Iran conflict caused the Strait of Hormuz to become partially blocked, with Persian Gulf route spot rates rising over 300% in a single day at the peak. The Shanghai Container Freight Index (SCFI) accumulated a 139% increase from late February to mid-2026.
Tariff frontloading: Importers accelerated shipments to beat potential tariff deadlines, creating a "peak season" in May-July that pulled demand forward. Rates from Asia to the U.S. West Coast increased 133% between weeks 1 and 24 of 2026.
Vessel capacity constraints: Red Sea diversions and Panama Canal draft restrictions removed effective capacity from the market. Industry estimates suggest effective capacity losses of 3% to 8% due to IMO emissions regulations forcing older vessels to slow down.
Current Status (August 2026): The "frontloading" demand surge has subsided. The Drewry World Container Index (WCI) stood at $4,297 per 40ft container as of August 6, 2026—down from peak levels but still elevated. Booking lead times have shortened from 3–4 weeks to 1–2 weeks on some U.S. West Coast routes.
According to logistics provider Rhenus, the traditional concept of a single peak season is "becoming outdated." Instead, demand now fluctuates in multiple waves across the year, driven by tariffs, promotional events, and inventory replenishment cycles rather than fixed seasonal patterns.
Implication: Historical seasonal patterns are no longer reliable predictors. Shippers must adopt a more agile, data-driven approach to capacity planning.
| Dimension | FCL (Full Container Load) | LCL (Less than Container Load) |
| Definition | Exclusive use of an entire container by a single shipper | Multiple shippers' cargo consolidated into one container |
| Typical Volume | >15 cubic meters (CBM) | 1–15 CBM |
| Container Options | 20ft (~28–33 CBM), 40ft (~58–68 CBM), 40ft HC (~76 CBM) | Pay-as-you-go, billed per CBM |
| Transit Time | Faster (no consolidation/deconsolidation delays) | +3–15 days (typically +5–7 days) for consolidation at origin and deconsolidation at destination |
| Damage Risk | Lower (container sealed and handled as a single unit) | Higher (multiple handling, shared space) |
| Customs | Single entry | May require coordination across multiple shippers |
The breakeven volume—where FCL becomes more cost-effective than LCL—typically falls between 12 and 18 cubic meters. Most industry analysis points to approximately 15 CBM as the practical threshold.
2026 Breakeven Estimates by Route:
| Trade Lane | Typical Breakeven Volume (CBM) |
| China → U.S. West Coast | 14–16 CBM |
| China → U.S. East Coast | 15–18 CBM |
| China → Northern Europe | 12–15 CBM |
| Cost Component | FCL | LCL |
| Base Ocean Freight | Fixed per container (e.g., $2,000–$3,800 for 20ft to USWC) | Per CBM (e.g., $80–$150 per CBM to USWC) |
| Origin Charges | THC (~$200), documentation | CFS handling fee (~$35–$75 per CBM) |
| Destination Charges | THC (~$200–$500), customs clearance | CFS deconsolidating fee (~$35–$75 per CBM) |
| Surcharges | BAF, PSS, congestion fees | Pro-rata share of surcharges |
FCL is typically 3–15 days faster than LCL. For a $100,000 shipment with a 10% annual holding cost, a 7-day delay adds approximately $192 in carrying costs. This can be significant for time-sensitive goods or high-value inventory.
LCL cargo is handled multiple times: consolidated at origin, deconsolidated at destination. Each handling point increases damage risk. For fragile or high-value goods, FCL's reduced handling can justify a premium.
LCL shipments incur CFS (Container Freight Station) fees at both origin and destination. These are often less transparent than FCL's fixed charges. Destination CFS fees on the U.S. side can range from $35 to $75 per CBM or more.
Choose FCL when:
Cargo exceeds 15 CBM.
Shipment is time-sensitive or high-value.
You have single-product or homogeneous cargo.
You want to minimize handling and the risk of damage.
Choose LCL when:
Cargo is under 12 CBM.
You have small batches or sample orders.
You are testing a new market or product.
Upfront cost is a primary constraint.
Step 1: Calculate Your Cargo Volume
Measure the actual cubic meters of your shipment (length × width × height per package, multiplied by the number of packages).
For LCL, note that the weight-to-volume ratio matters. If 1 CBM exceeds 1,000 kg, you may be billed on weight (chargeable weight) rather than volume.
Step 2: Estimate LCL Total Cost
Obtain LCL rate per CBM from your forwarder.
Add origin CFS fee ($35–$75 per CBM).
Add destination CFS fee ($35–$75 per CBM).
Add customs clearance and documentation fees.
Add transit time carrying cost (if applicable).
Step 3: Estimate FCL Total Cost
Obtain FCL rate for a 20ft or 40ft container.
Add origin THC (~$200).
Add destination THC (~$200–$500).
Add customs clearance and documentation fees.
Step 4: Compare Total Costs and Breakeven
If LCL total cost < FCL total cost, LCL is the better choice.
If FCL total cost < LCL total cost, FCL is the better choice.
The breakeven point is where the two costs converge.
Step 5: Factor in Non-Cost Considerations
Transit time: Is faster delivery worth the premium?
Damage risk: Is your cargo fragile or high-value?
Handling complexity: Are you prepared for multi-party coordination?
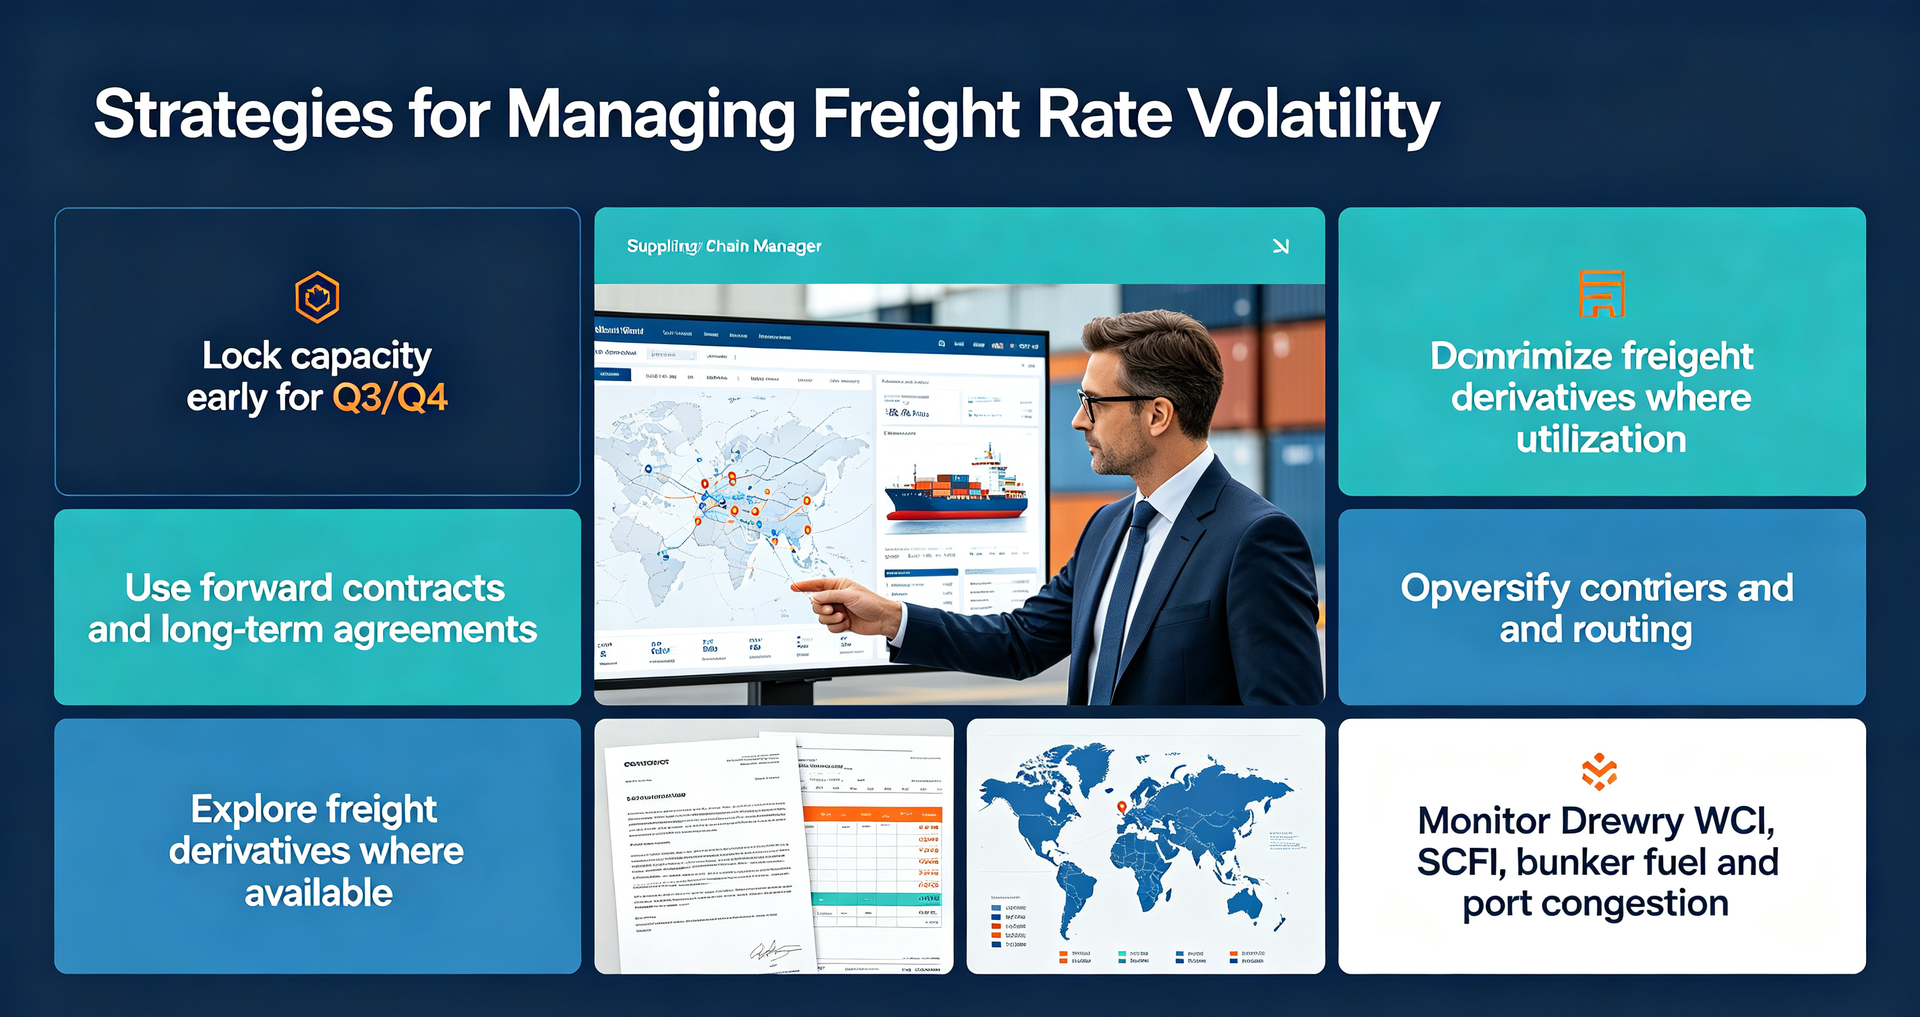
As the 2026 market demonstrated, capacity shortages can emerge rapidly. By mid-2026, major carriers had implemented General Rate Increases (GRIs) and Peak Season Surcharges (PSS) totaling thousands of dollars per container.
Action: Secure capacity for Q3/Q4 peak season in advance. Locking in a contract for a set volume at a fixed rate protects against both capacity shortages and spot rate spikes.
The traditional model of either spot rates or annual contracts (long-term agreements) is no longer sufficient. Shippers should consider:
Mixed strategies: A portion of volume on long-term contracts, a portion on the spot market for flexibility.
Index-linked pricing: Contracts that adjust rates based on indices like the Shanghai Container Freight Index (SCFI) or Drewry WCI provide more flexibility than fixed rates while protecting against extreme volatility.
Chinese enterprises have begun using container freight futures to hedge rate exposure. The EC2408 contract on the Europe trade lane has been used by Chinese freight forwarders to hedge 13-FEU shipments, turning potential $2,500+ per FEU losses into hedged positions with limited risk.
Current limitation: These tools are currently limited to the Europe trade lane and are not available for the U.S. trade. However, the model demonstrates the potential of financial hedging for freight costs.
For FCL shipments, maximizing container utilization reduces the per-unit freight cost. A 40ft container can hold approximately 58–68 CBM. Shippers should evaluate whether they are fully utilizing the capacity they are paying for.
For LCL, precise volume measurement is critical. Since LCL is billed by the CBM (with a weight-to-volume ratio of 1 CBM = 1,000 kg as a common threshold), understanding dimensional weight is essential to avoid unexpected costs.
As the market becomes more volatile, reliance on a single carrier creates vulnerability. Consider:
Tiered carrier strategy: Primary, secondary, and tertiary carriers to ensure redundancy.
Route diversification: Evaluate both West Coast and East Coast routing options. East Coast routes are currently experiencing tighter capacity than West Coast routes due to Panama Canal restrictions.
Supply chain managers should track:
Drewry WCI and SCFI indices for market rate benchmarks.
Bunker fuel prices: Fuel costs are a significant component of freight rates. Brent crude dropped from ~$121/barrel at the April 2026 peak to ~$80/barrel in August 2026.
Port congestion updates: Real-time visibility into port performance enables proactive adjustments.
A: The breakeven point typically falls between 12 and 18 CBM, with approximately 15 CBM as the practical industry threshold. Below 12 CBM, LCL is usually more cost-effective. Above 15 CBM, FCL becomes the better choice.
A: FCL charges a fixed rate for the entire container regardless of how much space you use. For small shipments (e.g., 5 CBM), you are paying for 28–76 CBM of container space. LCL allows you to pay only for the space you use.
A: LCL rates from China to the U.S. generally range from $80 to $150 per CBM, plus origin and destination CFS fees (approximately $35–$75 per CBM at each end). The total all-in cost can range from $150 to $300+ per CBM depending on the route and surcharges.
A: Consider a combination of long-term contracts for predictable volume, index-linked pricing for flexibility, and early capacity locking for peak season. For larger shippers, freight derivatives (where available) offer an additional hedging tool.
A: Yes. FCL is typically 3–15 days faster than LCL because LCL requires consolidation at origin and deconsolidating at destination. For time-sensitive goods, this difference can be significant.
A: CFS (Container Freight Station) fees are charges for handling LCL cargo at destination. They typically range from $35 to $75 per CBM. These fees are often less transparent than FCL's fixed charges and can significantly impact total landed cost.
In 2026, freight rate volatility is not a temporary disruption—it is a structural feature of the market. Supply chain managers who understand the drivers of volatility and adopt active management strategies will gain a competitive advantage over those who passively accept spot rates.
The key actionable insights from this guide:
Use the 15 CBM threshold as a starting point for FCL vs LCL decisions, but evaluate total cost—not just base freight.
Lock in capacity early, especially for peak season. The 2026 pattern of multiple "demand waves" makes early planning more important than ever.
Explore contract structures that combine long-term agreements with index-linked pricing for flexibility.
Track key market indicators to anticipate rate movements rather than react to them.
Consider financial hedging tools where available, and advocate for their expansion to U.S. trade lanes.






 Email: