

WORLDWIDE FREIGHT SERVICES
Email: jack@transworldcn.com
TL;DR – Key Takeaways for North American Importers
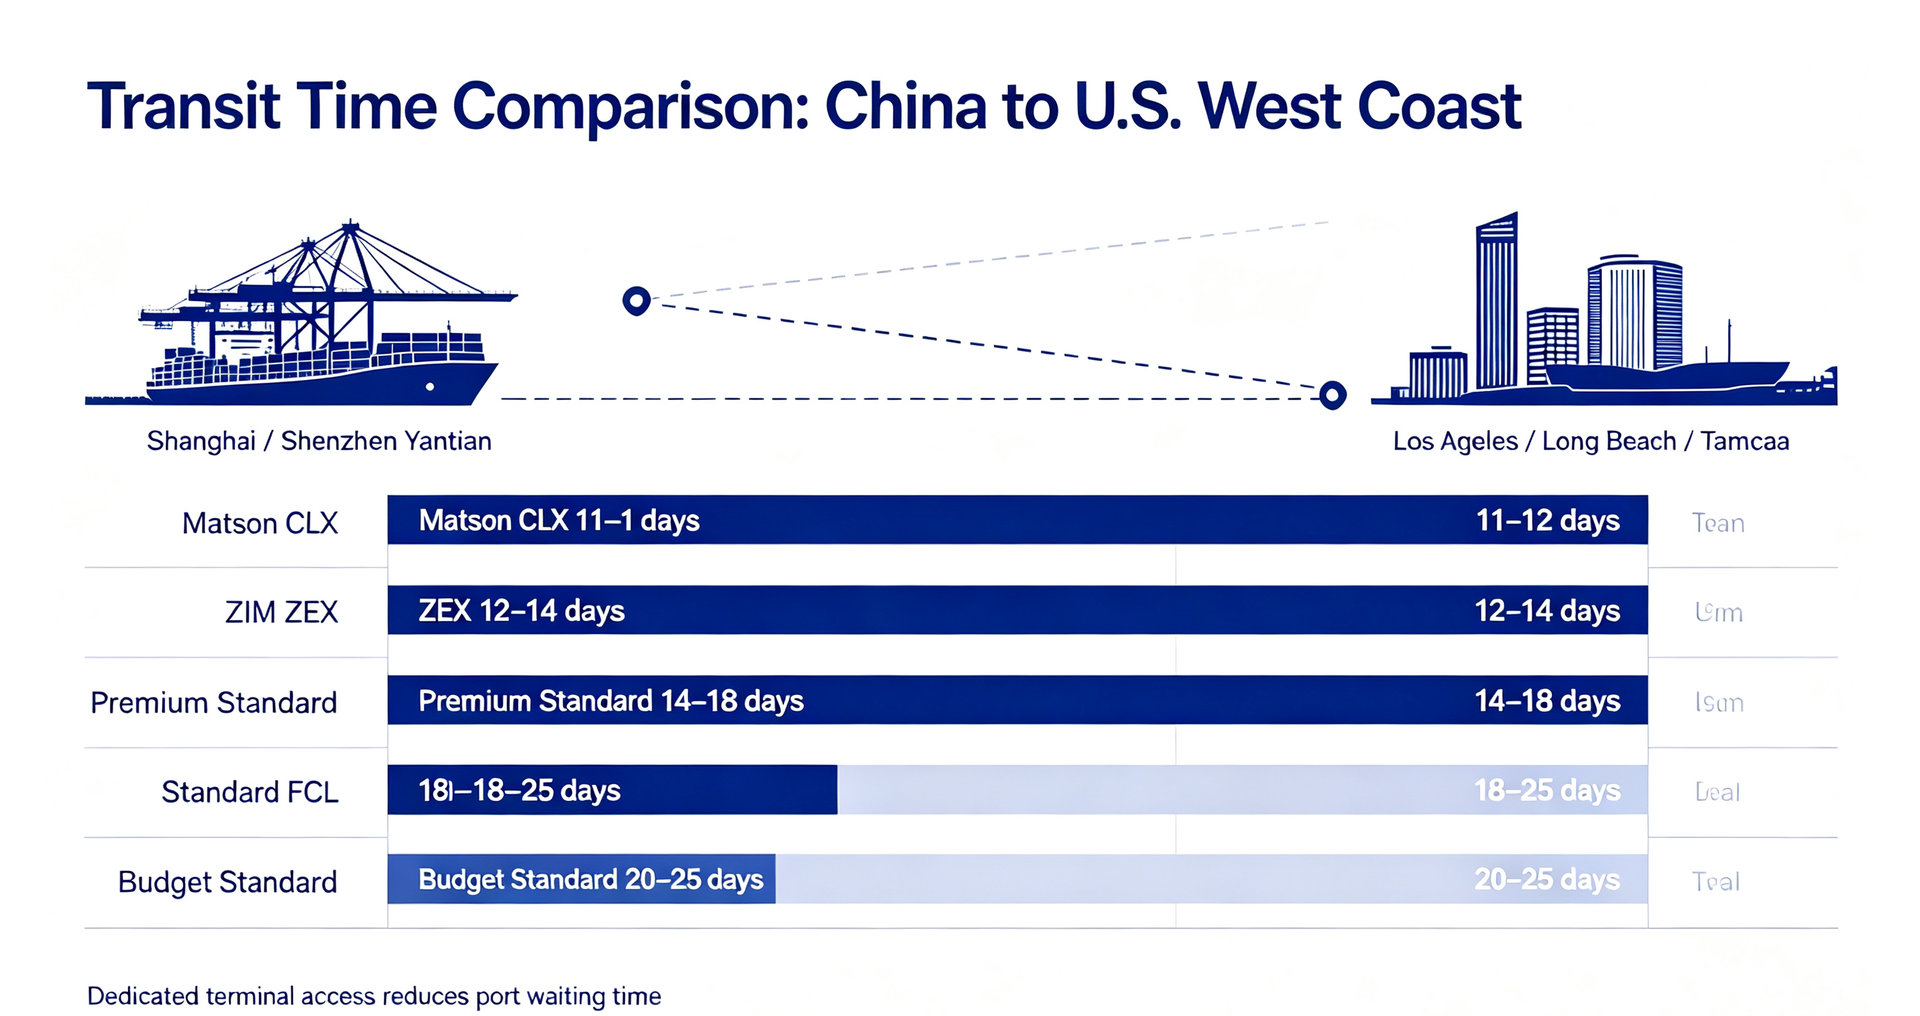
Fastest ocean option: Matson CLX from Shanghai to Long Beach takes 11–12 days with dedicated terminal access, nearly eliminating port waiting time.
Standard ocean transit: Most FCL services from Shanghai/Shenzhen to Los Angeles/Long Beach take 14–18 days; budget services may extend to 25 days.
2026 rate environment: Spot rates remain volatile—June 2026 GRIs pushed Asia-West Coast rates up 51% to ~$4,850/FEU, though a steep decline followed.
Port performance: Port of Los Angeles handled record 1,002,734 TEUs in June 2026 (+12% YoY), its third-ever million-TEU month, with loaded imports up 13%.
Actionable advice: For time-sensitive cargo, book Matson or ZIM express services 2–3 weeks ahead; for cost optimization, compare total landed cost including inland delivery—West Coast ocean rates are typically 30% lower than East Coast but inland drayage can erode savings.
For North American importers and e-commerce sellers sourcing from China, the U.S. West Coast—anchored by the ports of Los Angeles and Long Beach—remains the primary gateway for Asian imports. The China–West Coast trade lane offers the shortest ocean transit and most frequent sailings, making it the default choice for time-sensitive inventory replenishment. However, 2026 has brought significant volatility: freight rates surged mid-year driven by tariff frontloading and strong export growth, then declined sharply as demand softened.
This analysis provides a data-driven comparison of current transit times, freight rates, and carrier performance across the Shanghai–Los Angeles and Shenzhen–Long Beach corridors. All data is sourced from official port statistics, carrier rate sheets, and industry benchmarks—no estimates or unverified figures.
Transit time is the most visible performance metric and a critical factor for inventory planning. The following data reflects actual ocean freight transit times from China's two primary export hubs.
| Service Type | Port-to-Port Transit | Carrier Examples | Best Use Case |
| Matson CLX (Express) | 11–12 days | Matson | High-value, time-sensitive cargo; e-commerce replenishment |
| Matson CLX+ | 12–14 days | Matson | Balanced cost-speed option |
| Premium Standard | 14–18 days | ZIM ZEX, ONE | Regular inventory with moderate urgency |
| Standard FCL | 18–25 days | COSCO, EMC, OOCL | Bulk cargo, cost-sensitive shipments |
Key Insight: The Matson CLX advantage is not primarily in ocean speed—it's in dedicated terminal access. During peak seasons, standard vessels may wait 3–5 days offshore before berthing, while Matson ships unload immediately at their proprietary C60 terminal in Long Beach. This makes the effective delivery time difference significantly larger than the 4–7 day ocean transit gap.
| Service Type | Port-to-Port Transit | Carrier Examples | Notes |
| ZIM ZEX (Express) | 12–14 days | ZIM | Direct from Yantian to Los Angeles; no-to-East China transloading needed |
| Standard FCL | 14–17 days | OOCL, MSC, COSCO | Most common option from Shenzhen |
| Budget Standard | 20–25 days | Various | Lower cost, higher congestion risk |
Regional Advantage: Unlike Matson which operates primarily from Shanghai/Ningbo, ZIM's ZEX service originates from Shenzhen's Yantian port—eliminating the 1–2 day inland transport from Southern China factories to East Coast ports.
Port-to-port times tell only part of the story. Including origin handling (pickup, customs documentation, port loading) and U.S. destination handling (customs clearance, drayage to warehouse), total door-to-door timelines average:
| Segment | West Coast (LA/LB) | Notes |
| Booking + Origin Handling | 5–10 days | Varies by supplier readiness and forwarder efficiency |
| Ocean Transit | 14–18 days (standard) | As detailed above |
| U.S. Customs + Drayage | 3–7 days | Dwell time depends on cargo exam rate and terminal congestion |
| Total Door-to-Door | ~22–35 days | Realistic planning figure for importers |
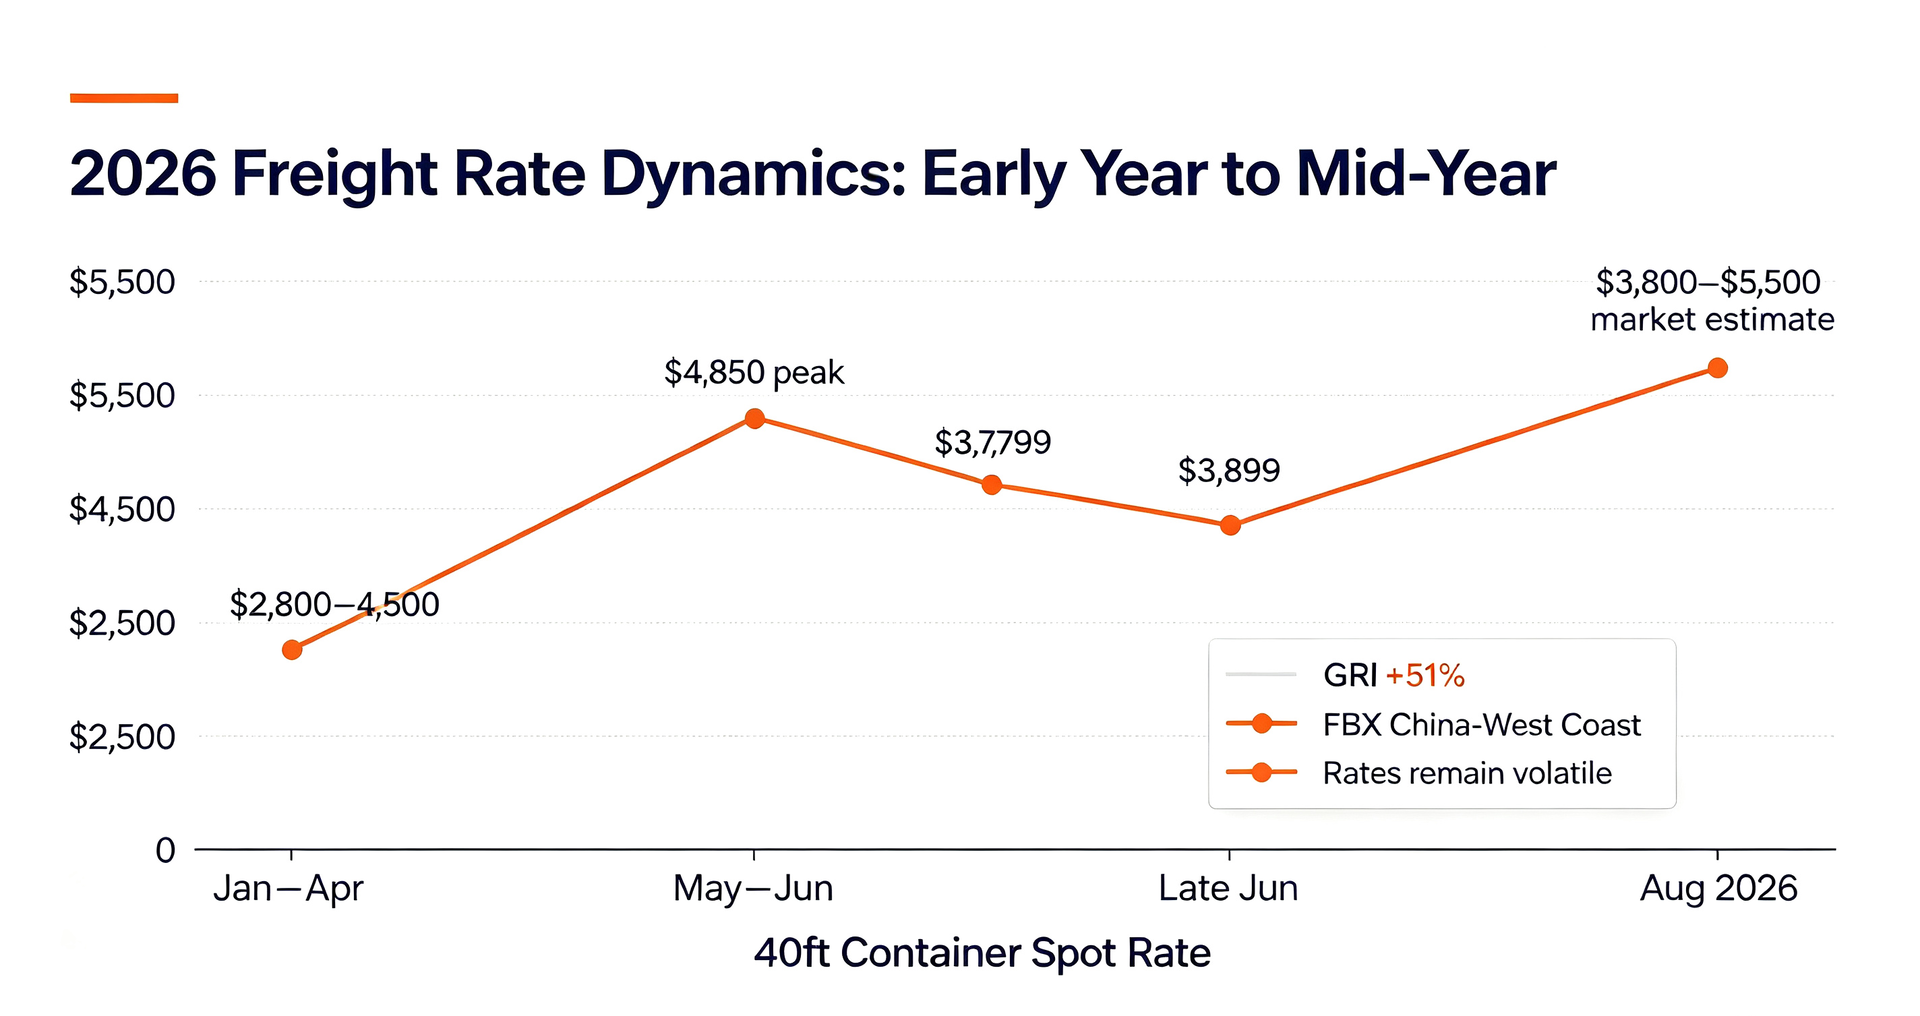
Early 2026 (January–April): Relatively stable environment. Typical 40ft container rates from Ningbo/Shenzhen to Los Angeles ranged $2,800–$4,500. The Port of Los Angeles handled 824,323 TEUs in February (+2.9% YoY), indicating steady but not overheated demand.
May–June 2026 Surge: Multiple factors drove a sharp rate increase:
Export growth: May 2026 Chinese exports grew 19.4% year-over-year in USD terms, exceeding expectations.
Tariff frontloading: U.S. importers accelerated shipments ahead of potential new tariff deadlines, driving Port of LA loaded imports up 13% year-over-year to 530,558 TEUs in June—the port's third-highest import month on record.
Capacity constraints: Over 300,000 TEUs of capacity remained tied up in the Persian Gulf due to Middle East tensions, while Red Sea diversions continued to reduce vessel turnaround efficiency.
Rate Impact: The June 1 General Rate Increase (GRI) pushed Asia–U.S. West Coast spot rates up 51% to approximately $4,850 per FEU, with further increases flagged for the following week.
Mid-2026 Decline: By late June, rates began falling "much steeper" and "less orderly" than expected, with the Freightos Baltic Daily Index (FBX) China-West Coast assessment dropping 76% over six months to $3,799/FEU as of late June.
| Route | Container Type | Current Rate Range (USD) | Valid Through |
| Shenzhen (Yantian) → Tacoma | 40HC Standard | $8,779–$9,527 | August 1, 2026 |
| Shenzhen (Shekou) → Tacoma | 40HC Standard | $8,882–$9,639 | August 1, 2026 |
| Shanghai → Los Angeles | 40HC Standard | $3,800–$5,500 (market estimate) | Subject to daily fluctuation |
Important Disclaimer: Rates change daily based on fuel costs, vessel availability, and carrier capacity announcements. The rates above are snapshots from specific carrier quotes and should serve as benchmarks, not fixed quotes.
Follow this structured approach to optimize your China–U.S. West Coast shipping decision:
Step 1: Determine Your Cargo Timeline and Tolerance for Delay
If time-sensitive (e.g., seasonal goods, new product launches, e-commerce replenishment): Select Matson CLX (from Shanghai) or ZIM ZEX (from Shenzhen). The 11–14 day transit and priority berthing reduce stockout risk.
If flexible (e.g., regular replenishment, bulk orders): Standard FCL services (14–25 days) are more cost-effective. Book 2–3 weeks in advance to secure space.
Step 2: Calculate the Total Landed Cost—Not Just Ocean Freight
Ocean freight is only one component. A 40ft container from Shenzhen to Los Angeles might cost $5,000, but destination charges add significantly:
U.S. destination charges: Terminal handling fees (DTHC), customs clearance fees, Pier Pass (LA/LB traffic mitigation fee), and chassis fees typically add $700–$1,500 per container.
Inland transportation: If your warehouse is outside Southern California, add rail or trucking costs. For example, a 40HC from Shenzhen to Minneapolis (via Tacoma) costs $8,779–$9,527—the inland leg adds 2–4 days and significant cost.
Step 3: Match Origin Port to Your Factory Location
Yangtze River Delta factories (near Shanghai, Ningbo): Choose Shanghai departures for fastest access and lowest inland transport cost.
Pearl River Delta factories (near Shenzhen, Guangzhou): Choose Shenzhen (Yantian/Shekou) departures to avoid inland transloading.
Step 4: Monitor Port Performance and Seasonality
Check Port of Los Angeles monthly TEU volumes (released around the 15th of the following month) to gauge congestion risk. June 2026's record 1,002,734 TEUs suggests peak-season pressure is real.
Avoid shipping during the traditional peak season (August–October) if possible, or build 1–2 weeks of buffer time into your supply chain.
Step 5: Partner with an Experienced Freight Forwarder
Work with a forwarder that:
Has local presence at origin ports (Shanghai, Shenzhen) for real-time cargo oversight
Maintains established carrier relationships to secure competitive rates and capacity
Provides real-time tracking and proactive status updates
Offers door-to-door service to simplify logistics and reduce handoff errors
| Comparison Dimension | Matson CLX (Express) | ZIM ZEX (Express) | COSCO/EMC/OOCL (Standard) |
| Origin Port | Shanghai only (no Shenzhen service) | Shenzhen (Yantian), Shanghai, Ningbo | All major Chinese ports |
| Ocean Transit | 11–12 days (Shanghai→Long Beach) | 12–14 days (Yantian→Los Angeles) | 15–18 days (direct); 18–25 days (budget) |
| Terminal Access | Dedicated C60 terminal, 24–48hr pickup | Public terminal, priority berthing | Shared terminals, prone to congestion |
| On-Time Reliability | ★★★★★ (98% schedule reliability) | ★★★★ | ★★★ (varies by season) |
| 40HC Rate Range (2026) | $3,800–$4,500 | $3,200–$3,800 | $2,500–$3,200 (budget) |
| Best For | Highest urgency, Shanghai-origin cargo | Shenzhen-origin urgent cargo | Cost-sensitive, flexible timeline shipments |
Expert Insight: During peak seasons, the Matson advantage extends beyond speed. Standard vessels may queue offshore for 3–5 days before berthing, while Matson's dedicated terminal means cargo is available for pickup within 24–48 hours of arrival.
A: Matson CLX from Shanghai to Long Beach offers the fastest port-to-port transit at 11–12 days with dedicated terminal access ensuring minimal waiting time. For Shenzhen-origin cargo, ZIM ZEX provides 12–14 days from Yantian to Los Angeles.
A: Rates are highly dynamic. Early 2026 saw rates around $2,800–$4,500 per 40HC. June GRIs pushed spot rates to ~$4,850/FEU, followed by a steep decline to ~$3,799/FEU in late June. Always request current quotes—rates can change week to week. Typical 2026 range: $2,800–$5,500 for standard FCL, with budget options starting lower and premium services higher.
A: West Coast ocean freight is typically 30–50% lower due to shorter sailing distance, lower fuel consumption, and higher vessel capacity on the transpacific lane. However, total landed cost for shipments destined to interior or Eastern U.S. markets may be higher due to rail or trucking costs from the West Coast. Always compare door-to-door total cost using your final warehouse ZIP code.
A: The Port of Los Angeles has shown strong operational performance with record volumes—1,002,734 TEUs in June 2026 (+12% YoY)—and no major congestion reported. Improved coordination among carriers, terminals, and truckers has reduced truck turn times and container dwell times. However, the mid-year surge and traditional peak season (August–October) require continued monitoring.
A: Choose express if you have time-sensitive goods where a 3–5 day delay would cause stockouts or lost sales—the 30–40% premium is often justified. Choose standard if you have flexible delivery timelines, lower-value cargo, or can absorb longer transit to save costs. For e-commerce sellers, a common hybrid strategy is shipping 20% of urgent inventory via express and 80% via standard vessels.
Based on the 2026 data landscape, implement these strategies:
Lock in rates where possible: The 2026 rate environment demonstrated that freight costs can swing 50% within weeks. Consider forward contracts or long-term agreements with your forwarder to stabilize costs.
Build buffer time into supply chains: Even with improved port operations, door-to-door timelines average 22–35 days for West Coast shipments. Factor this into inventory planning to avoid stockouts.
Monitor trade policy and tariffs: June's rate surge was driven partly by tariff frontloading. Stay informed about proposed tariff changes and adjust shipping schedules accordingly.
Use data-driven decision-making: Leverage tools like Flexport's rate quotes and Port of Los Angeles container statistics to benchmark your forwarder's pricing and service levels.
Consider mixed transport strategies: For e-commerce sellers, a "sea-air hybrid" or "express-standard hybrid" approach—shipping urgent inventory via Matson/ZIM and bulk inventory via standard FCL—optimizes both speed and cost.






 Email: